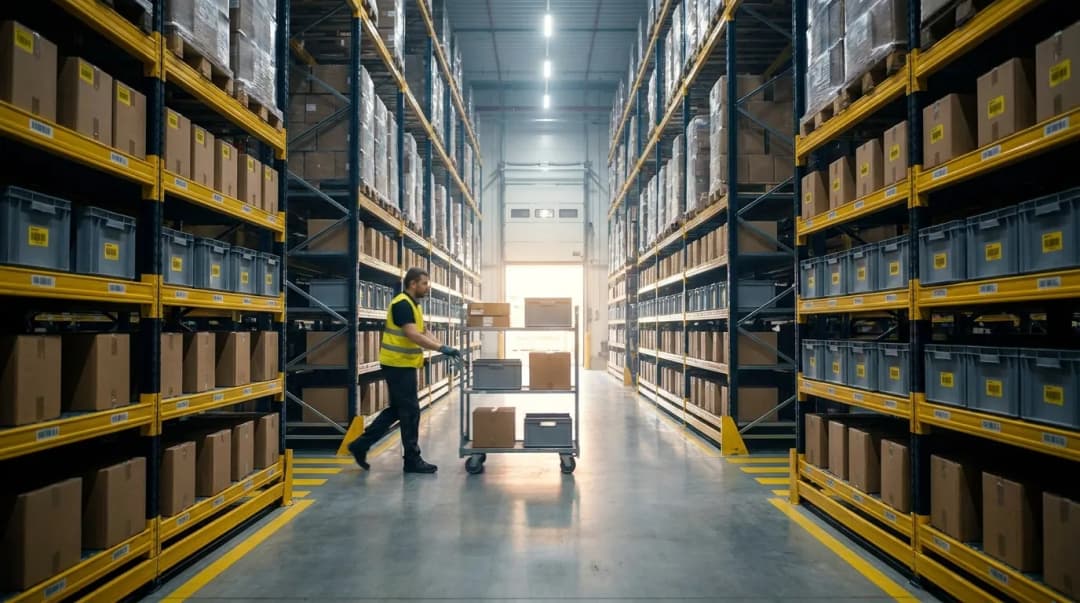



Why Your Supply Chain Control Tower Starts in the Warehouse
By Daryl Grove · October 6, 2026 · 14 min read
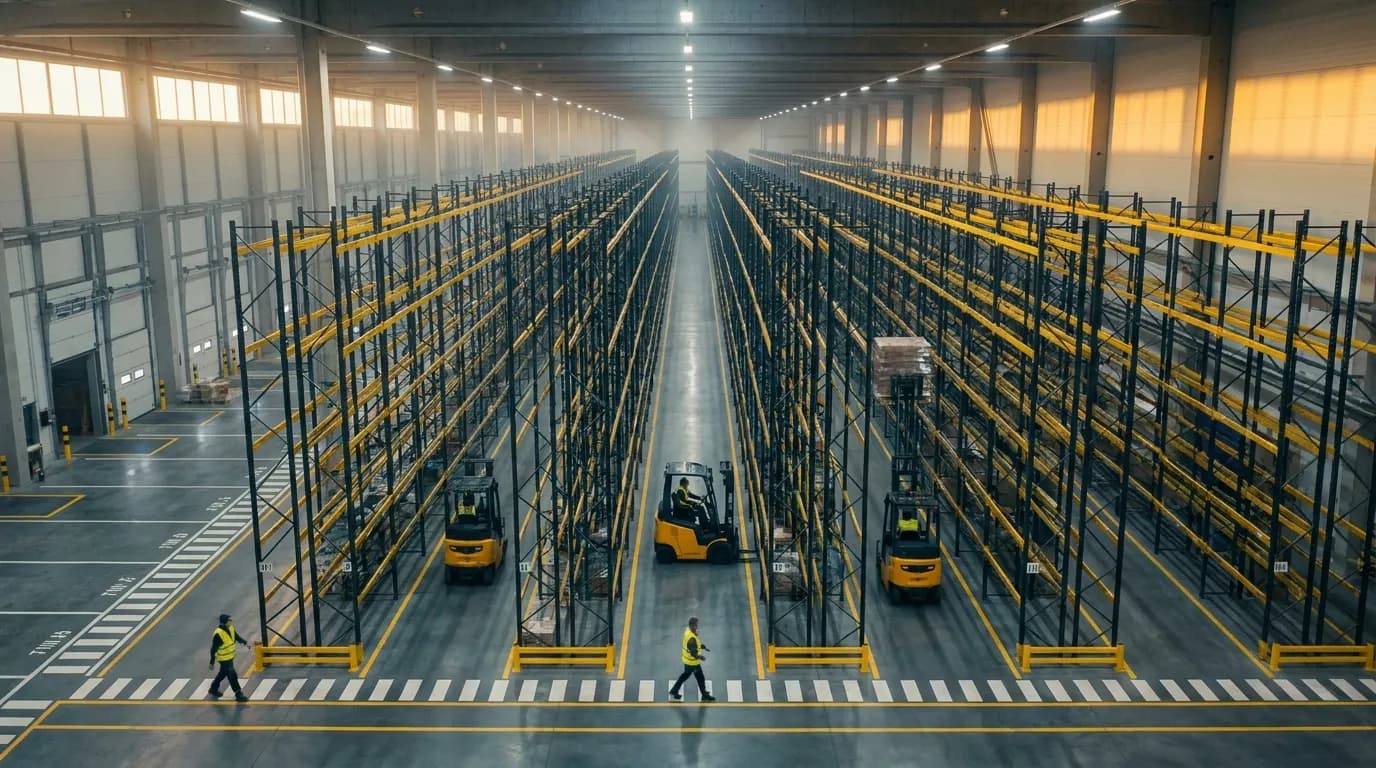
The Disruption Problem: Why Siloed Data Leaves Supply Chains Exposed
Disruption has stopped being an occasional event, and that shift is the main reason a supply chain control tower has moved from a nice idea to an operational priority. Tariff changes, swings in carrier capacity, labor shortages, severe weather and supplier failures now overlap. Each one spreads through inventory, orders and customer commitments within days. Leaders running multi-site or multi-client warehouse networks feel it first, because the warehouse is where a late container turns into a short-shipped order.
The core problem is rarely too little data. It is that the data sits in separate systems that cannot share it fast enough to matter. Operations teams reconcile spreadsheets while the window to act quietly closes. Closing that gap is the whole point of a control tower: it connects those systems into one operational picture and turns early signals into coordinated action.
What Disruptions Really Cost
The McKinsey Global Institute's 2020 report on risk and resilience in global value chains estimated that companies can expect a disruption lasting a month or longer about every 3.7 years. It also found that cumulative losses over a decade can add up to a sizable share of a full year's profits. Later McKinsey surveys of supply chain leaders found that many organizations still have limited visibility past their first tier of suppliers. The Business Continuity Institute publishes an annual resilience report that tracks how often disruptions occur and how they affect businesses across industries.
The pattern across this research is consistent. The event itself drives only part of the cost. The rest comes from how long it takes to detect the problem and respond. Picture a week between a missed sailing and a revised pick plan: that is a week of expedited freight, idle labor and broken promises to customers.
The Blind Spots Between WMS, TMS, ERP and EDI
Typical gaps look like this:
- WMS: on-hand inventory is accurate within one building but not reconciled across the network or with 3PL partners.
- TMS: transportation teams can see carrier delays, but the warehouse is still planning labor and dock appointments around the original schedule.
- ERP: orders and purchase orders reflect the plan, not what physically happened on the floor.
- EDI: ASNs (856), order acknowledgments and status messages arrive late, fail validation or never reach the people who need them.
Each system is correct on its own terms. Taken together, they leave a gap where disruptions go unnoticed until a customer calls asking where the order is.
What Is a Supply Chain Control Tower?
At its simplest, it is a connected layer of data, analytics, people and processes that gives teams end-to-end visibility with minimal delay and helps them detect, decide on and resolve exceptions quickly. Gartner frames the idea in similar terms: a combination of people, process, data, organization and technology that captures supply chain data and uses it to support short- and long-term decisions tied to strategic goals.
The word that matters most is act. This is more than a screen showing where trucks are. It is an operating model that flags what went wrong, estimates what it will affect, recommends a next step and then checks whether the fix held.
Core Capabilities: Sense, Analyze, Decide, Act
- Sense: capture events from WMS, TMS, ERP, EDI and IoT sources as they occur, including receipts, picks, ship confirmations, ASNs and carrier status.
- Analyze: compare actuals with plans and thresholds to spot exceptions and size their impact on orders, customers and inventory.
- Decide: recommend or apply responses such as reallocating stock, expediting, rerouting or rebalancing labor, guided by business rules and, at higher maturity, predictive models.
- Act: send decisions to execution systems and trading partners, then measure the result.
Control Tower vs. Dashboards and Standalone Visibility Tools
The difference shows up in five areas: data latency, scope, exception handling, the ability to act, and outcome tracking.
- BI dashboard: runs on daily or batch data and exists for reporting. Exceptions surface only when someone reviews the charts, nothing flows back to execution, and results are measured after the fact.
- Standalone visibility tool: offers near-live data, but usually for a single domain such as freight or one inventory pool. Alerts are basic, options for action are limited, and outcome tracking is partial.
- Control tower: draws live or close-to-live feeds across inventory, orders, freight, suppliers and labor. Rule-based and predictive alerts arrive with an estimate of impact, decisions are written back into execution systems and partner channels, and closed-loop KPIs such as TTR, OTIF and fill rate confirm whether each response worked.
Dashboards are useful. They are just not built to change what happens next on the dock.
Where Control Tower Data Actually Comes From
- WMS: on-hand and location-level inventory, receipts, dock-to-stock status, picks, shipments and labor productivity. Planning practices such as wave pre-planning affect how cleanly pick and labor events reach the tower.
- EDI and APIs: purchase orders (850), ASNs (856), invoices (810), status messages and partner inventory feeds from suppliers, customers and 3PLs, typically exchanged in ASC X12 formats.
- TMS: carrier assignments, tracking milestones, ETAs and freight costs.
- ERP: demand, purchase orders, financial records and master data.
- IoT and RFID: location, condition and movement data for assets, pallets and high-value stock.
Of these, the WMS and EDI feeds usually carry the most time-sensitive execution signals. Their speed and accuracy set the ceiling on how far anyone can trust the alerts that follow.
Supply Chain Visibility: The Foundation of Every Control Tower
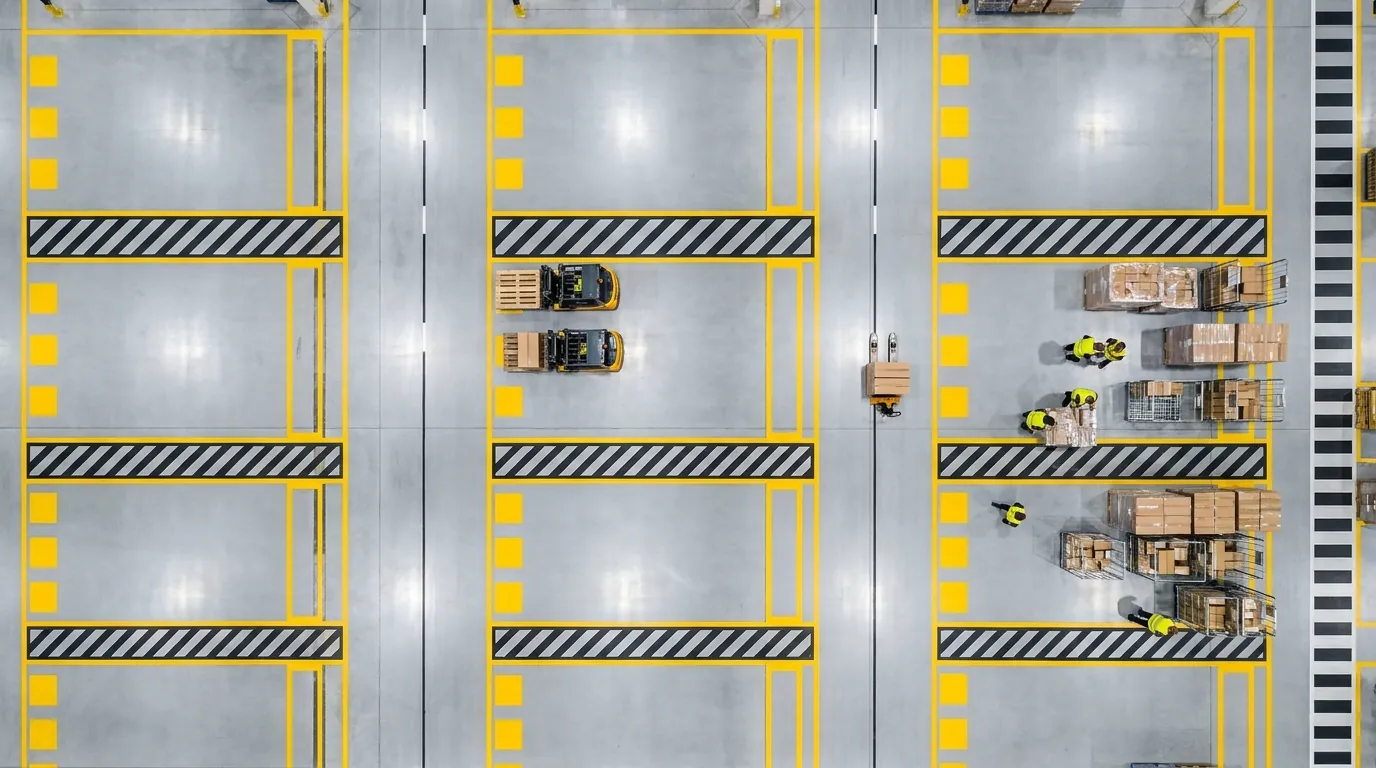
Supply chain visibility means knowing, with confidence and in time to act, where inventory, orders and shipments are and what condition they are in, across your own sites and your partners' operations. It is not a feature you buy. It is a property of your data, and when that data arrives late or wrong, the dashboard shows a picture that does not match the floor. For a broader introduction, see this primer on visibility fundamentals.
The tower therefore inherits the quality of every system feeding it. Before funding advanced analytics, leaders should find out what visibility they actually have today and where the weakest link sits.
Tier-1 vs. Multi-Tier and Real-Time Visibility
Tier-1 visibility covers direct suppliers, carriers and customers, typically through EDI and partner portals. Multi-tier visibility reaches your suppliers' suppliers, where many disruptions begin. A component shortage two tiers upstream can stall production weeks before a direct vendor reports a problem. Real-time is about latency: learning that an event happened within minutes instead of at the next batch run. Most organizations have partial tier-1 coverage updated in batches, while resilient networks pair multi-tier reach with execution data that arrives as events happen.
Why Warehouse Inventory Accuracy Is the Critical Layer
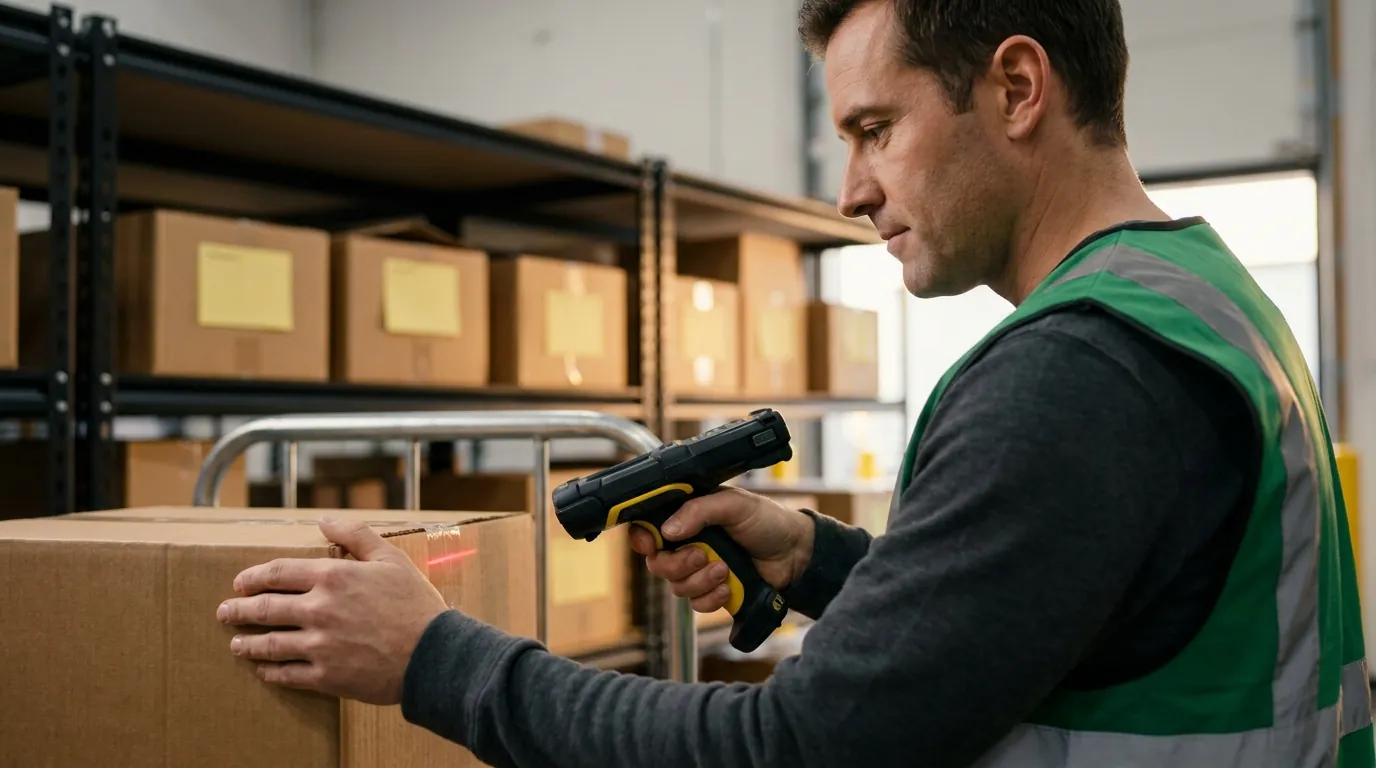
Every allocation, promise date and reroute assumes on-hand counts are correct. When they are not, the tower confidently recommends the wrong move, such as fulfilling from a site that cannot actually ship the order. The fix happens at the source: directed putaway, scan-based confirmation using RF scanners or RFID tags, regular cycle counting, and transactions posted to the WMS the moment they occur. A sensible goal is location-level accuracy of 99% or better before scaling automated decisions.
Consider a hypothetical distributor whose system shows 40 cases of a fast mover in its Dallas building while the shelf holds 12. Any reallocation built on that number sends orders to a site that will short them, and the alert that should have fired never does.
The 4-Level Visibility Maturity Model
Two abbreviations appear below: TTR, the recovery time after a disruption, and TTS, the stretch operations can hold out before customers feel it. Both are covered in detail in the resilience section.
- Level 1, Siloed: each system and site reports separately through spreadsheets and batch reports. Customers discover disruptions first, and TTR is measured in weeks.
- Level 2, Tier-1 Connected: WMS, ERP and EDI are integrated with direct partners, typically with daily EDI and WMS inventory snapshots. Detection gets faster, but response is still manual.
- Level 3, Multi-Tier and Real-Time: event-driven data flows across sites, 3PLs, carriers and key sub-tier suppliers through WMS events, APIs and IoT. Teams reroute and reallocate proactively, and recovery shortens materially.
- Level 4, Predictive and Prescriptive: models combine historical and live data with external risk feeds to forecast disruptions and recommend actions. Problems are mitigated before impact, and TTR stays below TTS.
Most mid-market networks sit between Levels 1 and 2. Reaching Level 3 usually depends more on warehouse and EDI data quality than on new analytics, which is why so many control tower projects begin inside the WMS.
From Visibility to Supply Chain Resilience: How Control Towers Reduce Time-to-Recover
Supply chain resilience is the ability to anticipate, absorb and recover from disruption while still meeting customer commitments. MIT professor David Simchi-Levi popularized two practical measures in Harvard Business Review (2014): time-to-recover (TTR), how long a node takes to return to full function, and time-to-survive (TTS), how long the network can keep serving customers once that node goes down. The goal is to keep TTR shorter than TTS. Control towers help by shrinking the gap between an event and an effective response. The scenarios below are illustrative, not customer case studies.
Scenario 1: Port Delay
Carrier milestones and missing ASN updates flag inbound containers arriving nine days late. The tower matches affected POs to open orders and on-hand stock, revealing which SKUs will run out at which DC. Planners reallocate inventory from a second DC, protect high-value accounts and air-freight a partial load of critical items. Revised allocations reach the WMS, customers get updated EDI acknowledgments, and receiving labor is replanned. Without that connected view, the same delay often surfaces only when a dock appointment sits empty.
Scenario 2: Supplier Shortfall
A supplier's ASN shows 60% of the ordered quantity, pushing coverage under the safety threshold at two sites. The team sends the balance to a secondary supplier, consolidates stock where priority demand sits and resets promise dates. New POs go out through EDI, transfer orders are created, and customer service works a ranked exception list instead of finding shortages at pick time.
Scenario 3: Labor Gap at a Key Site
Productivity data shows second shift running 25% short, enough to miss same-day carrier cutoffs. Eligible orders move to a nearby site or 3PL partner, waves are re-sequenced to protect OTIF on priority accounts, and cross-trained staff are reassigned. Throughput is then monitored until it returns to normal.
Redundancy, Agility and Multi-Node Fulfillment
Resilience rests on two levers. Redundancy means buffers: safety stock, backup suppliers and spare capacity. Agility means redeploying existing resources by shifting orders between nodes, rebalancing inventory and moving labor. Holding buffers everywhere is costly, so the practical approach pairs targeted reserves with fulfillment across sites, orchestrated in hours rather than days. Trusted partner data matters here as well, which is why some networks are exploring shared ledgers for supply chain traceability.
KPI Table: Linking Control Tower Capabilities to Resilience Metrics
Each capability maps to a metric you can track. The list below pairs them and notes where the underlying data comes from. For more on defining these measures, see this overview of supply chain KPIs.
- TTR (disruption detection and response): how fast a node returns to normal. Sources: WMS, TMS and ERP events.
- TTS (network buffer analysis): how long demand can be met without a given node. Sources: inventory, demand and capacity data.
- OTIF, on-time and in-full (order exception management): whether customer promises are kept. Sources: WMS ship confirmations, EDI and carrier data.
- Inventory accuracy (inventory reconciliation): whether system stock matches physical stock. Source: WMS cycle counts.
- Fill rate (allocation and multi-node sourcing): share of orders filled from available stock. Sources: WMS and ERP orders.
- Days of supply (supply risk monitoring): the coverage current stock provides. Sources: WMS on-hand balances and ERP forecasts.
- Dock-to-stock time (inbound flow management): how quickly receipts become usable inventory. Sources: WMS receiving records and ASNs.
Implementation Roadmap: 5 Steps to Build a Control Tower on Your Existing WMS and EDI Stack
You do not need to rip out the systems running your warehouses. The safer route is to strengthen execution, connect what you already own, and add intelligence in stages. Each step follows the maturity model and pays off on its own.
Step 1: Audit Your Data Sources and Accuracy
List every system and partner feed: WMS instances, 3PL portals, EDI transaction sets, TMS, ERP and IoT devices. Record latency, ownership and error rates for each. A shared spreadsheet with one row per feed is enough to start. Measure inventory accuracy by site and ASN accuracy by supplier, then fix the weakest sources first. If one building's counts are routinely off, every alert it triggers becomes suspect.
Step 2: Integrate Instead of Replace
Link existing platforms through EDI and APIs into a shared data layer. Prioritize event-driven feeds for receipts, shipments, inventory adjustments and ASNs. Standardize master data (SKUs, locations, partner IDs) so a receipt in Ohio means the same thing as one at a 3PL in Texas. Swap out a system only when it cannot deliver timely, accurate data.
Step 3: Define Exception Rules and Alerts
Begin with a handful of high-impact exceptions: late or short ASNs, days of supply below safety stock, orders likely to miss carrier cutoff, and receipts sitting too long before putaway. Each needs a named owner, a threshold and a standard response. An alert nobody owns is just noise.
Step 4: Add Predictive and AI-Driven Analytics
Once data is trusted and exception workflows run reliably, introduce models for ETA prediction, demand sensing, supplier risk scoring and labor forecasting. Let them recommend actions first. Automate only where outcomes are predictable and easy to reverse. For example, an ETA model might notice that one lane has run two days late for three straight weeks, prompting a planner to pull safety stock forward before the next booking.
Step 5: Review KPIs Continuously
Hold a recurring review of TTR, OTIF, fill rate, inventory accuracy, stock coverage and receiving speed. After major disruptions, run post-incident reviews to tune thresholds and playbooks. Track the maturity of each site and partner, and set targets for advancing.
Common Pitfalls and Selection Criteria
Projects tend to stall for predictable reasons:
- Building dashboards before cleaning up warehouse data.
- Leaving 3PL and partner feeds out, which keeps the largest blind spots in place.
- Flooding teams with alerts that lack clear owners.
- Treating the effort as an IT project instead of a change in how operations run.
Matching the speed and transparency Amazon made standard requires technology with:
- Real-time transaction posting at the warehouse level.
- Native, well-supported EDI and API integration.
- Multi-site and multi-client operation.
- Configurable exception rules and workflows.
- The ability to push decisions back into execution, not just display them.
For the wider selection process, these tips for choosing WMS software cover functional fit, scalability and vendor questions.
How a Warehouse Management System Supports Control Tower Visibility and Resilience
Any control layer is only as actionable as the execution systems underneath it. Cadre Technologies concentrates on that execution layer: warehouse management and EDI integration for distributors, manufacturers, retailers and 3PLs that run multi-site or multi-client operations. The aim is warehouse data that is accurate, timely and connected, so higher-level visibility and resilience initiatives have something reliable to stand on.
Real-Time Warehouse Data as the Source of Truth
A warehouse management system can record receiving, putaway, picking, cycle counts and shipping as each transaction happens instead of posting them in an overnight batch. When operators scan to confirm moves, location-level inventory accuracy tends to improve because the system and the shelf stay in agreement. A pallet moved from aisle 12 to a forward pick slot shows up in its new spot right away. Planners watching the network then work from on-hand quantities and order status they can act on during the shift, not end-of-day snapshots that are already stale. When comparing platforms, ask how quickly each transaction type posts and which steps require a scan.
EDI Integration That Feeds the Control Tower
Integrated EDI can exchange purchase orders, advance ship notices, shipment confirmations and invoices with trading partners. When a supplier's ASN arrives, receiving teams know what is coming before the truck backs in, and outbound status can flow back to customers without manual rekeying. Clean partner data matters for another reason: exception rules depend on it. A late ASN or a quantity mismatch can only trigger an alert if the underlying documents are complete and current. That makes EDI validation, partner onboarding and error handling worth examining as closely as the warehouse functions themselves.
Multi-Site and 3PL Execution
Networks with several facilities, and 3PLs serving many clients, need to manage inventory and orders across buildings and accounts from one system. A WMS with a consolidated, cross-facility inventory view gives planners the information behind the reallocation moves described in the earlier scenarios. Seeing that a sister building holds the stock is the first half of the response; the second half is acting on it. When evaluating platforms, check whether moving an order to another site is a configured workflow or a manual workaround, and how client-level inventory is kept separate for 3PLs that report to many owners.
Key Takeaways
- Control towers are operating models, not dashboards: they sense, analyze, decide and act.
- Visibility across the network depends on warehouse inventory accuracy and timely EDI data.
- Resilience is measurable: keep TTR below TTS, and track on-time delivery, fill rate and stock coverage.
- Build in stages on the warehouse and partner systems you already run rather than replacing them.
- Fix location-level accuracy before automating decisions, because every recommendation inherits the quality of the data beneath it.
Request a Demo to see Cadre Technologies' approach to warehouse execution.
Frequently Asked Questions
What is a supply chain control tower?
It is a connected layer of data, analytics, people and processes that gives teams near-real-time visibility and helps them resolve exceptions quickly. It works through four capabilities: sensing events from WMS, TMS, ERP and EDI feeds, analyzing them against plans, deciding on a response such as reallocating stock, and acting by sending that decision back to execution systems and partners.
How is a control tower different from a BI dashboard?
A dashboard reports what happened, while a control tower flags exceptions, sizes their impact and pushes decisions back into execution. BI dashboards usually run on daily or batch data and rely on manual review. A control tower works with near-real-time data across inventory, orders, freight, suppliers and labor, and tracks outcomes through closed-loop KPIs like OTIF and fill rate.
Why does warehouse inventory accuracy matter so much for supply chain visibility?
Every allocation, promise date and reroute a control tower recommends assumes on-hand counts are correct. If they are wrong, the system may confidently fulfill from a site that cannot ship the order. A sensible target is location-level accuracy of 99% or better, supported by scan-based confirmation, regular cycle counting and transactions posted to the WMS as they happen, before scaling automated decisions.
What are time-to-recover and time-to-survive?
Time-to-recover (TTR) is how long a node takes to return to full function after a disruption, and time-to-survive (TTS) is how long the network can keep serving customers without that node. MIT professor David Simchi-Levi popularized both measures in Harvard Business Review in 2014. The resilience goal is keeping TTR shorter than TTS so customers never feel the outage.
Do I need to replace my WMS to build a control tower?
No. The safer route is to integrate existing platforms through EDI and APIs into a shared data layer rather than ripping them out. Start by auditing each data source for latency, ownership and error rates, then standardize master data such as SKUs, locations and partner IDs. Replace a system only when it cannot deliver timely, accurate data.
Which EDI transactions feed a control tower?
The most time-sensitive EDI feeds are purchase orders (850), advance ship notices (856) and invoices (810), along with status messages and partner inventory feeds. These are typically exchanged in ASC X12 formats. A late or short ASN can only trigger an alert if the underlying documents arrive complete and current, so partner data quality directly limits how useful exception rules can be.