Mastering Inventory Turnover Calculation: A Practical Guide

Mastering Inventory Turnover Calculation: A Step-by-Step Practical Guide
In the fast-paced world of supply chain and logistics, understanding inventory turnover is crucial for maintaining operational efficiency and optimizing warehouse management. This guide will walk you through the essentials of inventory turnover calculation, a key metric that can significantly enhance your decision-making processes and lead to substantial cost savings. By mastering this calculation, supply chain professionals can gain deeper insights into their inventory management practices, ultimately driving business success.
Smarter Warehouse Management Starts Here
Cadre WMS delivers real-time visibility, automated workflows, and seamless ERP integration for warehouses of every size.
Request a DemoUnderstanding Inventory Turnover: Definition and Importance
Inventory turnover is a financial ratio that measures how often a company’s inventory is sold and replaced over a specific period. This metric is vital for warehouse managers and supply chain professionals as it provides insights into the efficiency of inventory management and sales performance. A high inventory turnover rate indicates that a company is effectively managing its stock, reducing holding costs, and minimizing the risk of obsolescence. On the other hand, a low turnover rate may suggest overstocking or sluggish sales, which can tie up capital and increase storage costs.
Effective inventory turnover calculation is not just a number-crunching exercise; it is a strategic tool that can lead to improved decision-making. By understanding this metric, businesses can optimize their inventory levels, enhance cash flow, and ultimately achieve better profitability. Moreover, it allows companies to identify trends and adjust their strategies accordingly, ensuring they remain competitive in the market.
The Basic Formula for Inventory Turnover Calculation
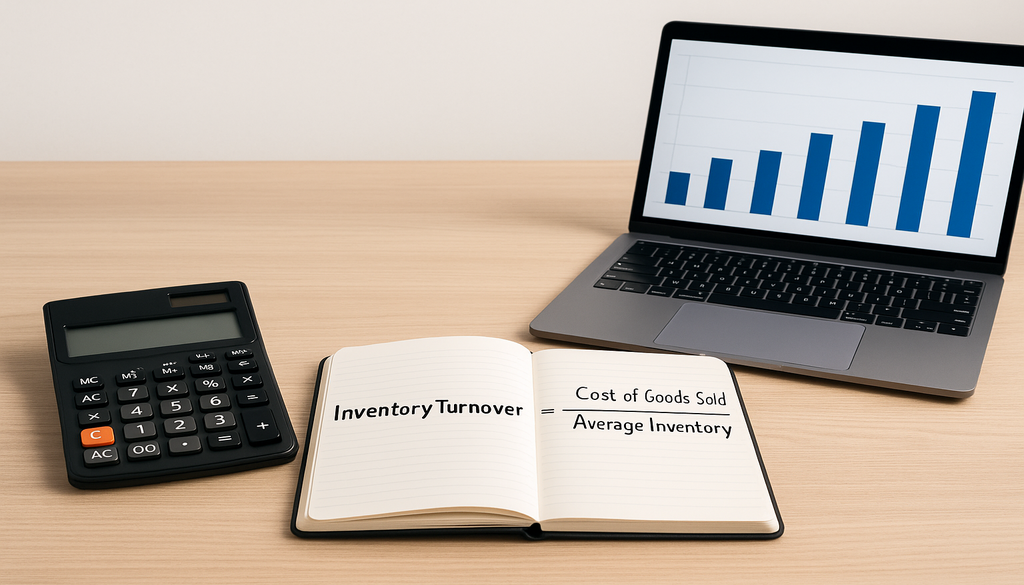
The standard formula for calculating inventory turnover is straightforward:
Inventory Turnover Ratio = Cost of Goods Sold (COGS) / Average Inventory
This formula provides a clear picture of how many times inventory is sold and replaced over a given period. The Cost of Goods Sold (COGS) represents the direct costs attributable to the production of goods sold by a company, while the Average Inventory is calculated by adding the beginning and ending inventory for a period and dividing by two.
However, variations of this formula may be necessary depending on the type of inventory or business model. For instance, companies dealing with seasonal products might adjust the average inventory calculation to reflect seasonal peaks and troughs more accurately. Similarly, businesses with multiple product lines may need to calculate turnover for each line separately to gain more precise insights.
Step-by-Step Guide on How to Calculate Inventory Turnover
Calculating inventory turnover involves a systematic approach to ensure accuracy and reliability. Here’s a step-by-step guide to help you through the process:
- Determine the Time Period: Decide the period for which you want to calculate the turnover, such as monthly, quarterly, or annually.
- Calculate Cost of Goods Sold (COGS): Sum up all the direct costs associated with the production of goods sold during the chosen period. This includes materials, labor, and overhead costs.
- Compute Average Inventory: Add the beginning inventory to the ending inventory for the period and divide by two. This gives a more balanced view of inventory levels over time.
- Apply the Formula: Divide the COGS by the Average Inventory to get the inventory turnover ratio.
- Interpret the Results: Analyze the turnover ratio to understand your inventory management efficiency.
Common pitfalls in this calculation include using inaccurate COGS figures or failing to account for seasonal inventory fluctuations. To avoid these, ensure your financial records are up-to-date and consider any external factors that might affect inventory levels.
Analyzing Your Inventory Turnover Ratio: What the Numbers Tell You
Once you have calculated your inventory turnover ratio, the next step is to interpret the results. A high turnover ratio typically indicates strong sales performance and efficient inventory management, suggesting that products are moving quickly through the supply chain. Conversely, a low turnover ratio may point to overstocking, poor sales, or ineffective inventory management.

Industry benchmarks can provide valuable context for your turnover ratio. For example, the retail industry often aims for a turnover ratio of 8-12, while manufacturing might see lower ratios due to longer production cycles. Comparing your ratio against these benchmarks can help identify areas for improvement and set realistic targets for your business.
Strategies to Optimize Your Inventory Turnover
Improving your inventory turnover ratio requires strategic planning and execution. Here are some actionable strategies to consider:
- Enhance Demand Forecasting: Use historical sales data and market trends to predict future demand accurately. This helps in maintaining optimal inventory levels and reducing excess stock.
- Implement Just-In-Time (JIT) Inventory: Adopt JIT practices to reduce inventory holding costs and improve cash flow by receiving goods only as they are needed in the production process.
- Optimize Supplier Relationships: Work closely with suppliers to ensure timely deliveries and negotiate favorable terms that align with your inventory needs.
- Regular Inventory Audits: Conduct periodic audits to identify slow-moving or obsolete stock and take corrective actions, such as discounts or promotions, to clear excess inventory.
Real-world examples, such as Toyota’s implementation of JIT inventory, demonstrate how these strategies can lead to significant improvements in inventory turnover and overall operational efficiency.
Tools and Technologies to Aid in Inventory Turnover Analysis
Incorporating technology into your inventory management processes can greatly enhance the accuracy and efficiency of turnover calculations. Inventory management software solutions, such as SAP, Oracle, and QuickBooks, offer automated data collection and real-time analytics, allowing businesses to monitor inventory levels and turnover ratios effortlessly.

These tools provide comprehensive dashboards and reporting features that help identify trends, inefficiencies, and opportunities for improvement. By integrating technology into your inventory management strategy, you can make data-driven decisions that optimize inventory levels and enhance overall business performance.
Conclusion
Mastering inventory turnover calculation is essential for effective inventory management and operational success. By understanding and analyzing this critical metric, supply chain professionals can make informed decisions that enhance efficiency, reduce costs, and improve profitability. Implementing the strategies and tools discussed in this guide will empower you to optimize your inventory turnover, ensuring your business remains competitive and agile in the ever-evolving market landscape.
Frequently Asked Questions (FAQ)
Why is inventory turnover important for a business?
Inventory turnover is crucial as it indicates the efficiency of a company in managing and selling its inventory. A high turnover rate suggests effective inventory management, which directly impacts profitability and liquidity by reducing holding costs and freeing up capital for other business activities.
How often should inventory turnover be calculated?
The frequency of inventory turnover calculation can vary depending on the business type and inventory dynamics. Typically, it is calculated monthly, quarterly, or annually to track performance and make necessary adjustments. Regular monitoring helps businesses respond swiftly to changes in demand and market conditions.
Can inventory turnover vary by industry?
Yes, inventory turnover rates can significantly vary across different industries due to factors like product type, market demand, and business model. For instance, industries with perishable goods, like food and beverages, tend to have higher turnover rates compared to those dealing with durable goods, such as furniture.
What is a good inventory turnover ratio?
A “good” inventory turnover ratio varies by industry, but generally, a higher turnover indicates efficient inventory management. Comparing against industry benchmarks can provide a more specific target. For example, a turnover ratio of 8-12 is often considered good in retail, while manufacturing might have lower benchmarks.
How can technology improve inventory turnover calculations?
Technology significantly improves inventory turnover calculations by automating data collection and delivering real-time analytics. Inventory management systems eliminate manual processes, reducing errors and saving time while helping businesses identify trends and inefficiencies more effectively. These capabilities enable faster, more informed decision-making, allowing companies to optimize inventory levels and improve overall supply chain efficiency. The result is better control over stock, reduced holding costs, and the ability to respond quickly to shifting demand.